Buyer's guide
How to Choose an AI Data Analysis Tool in 2026
Choose an AI data analysis tool by matching its operating model to your data, governance, and review needs: spreadsheet copilot, governed BI assistant, notebook copilot, or bounded file-analysis assistant.
Direct answer
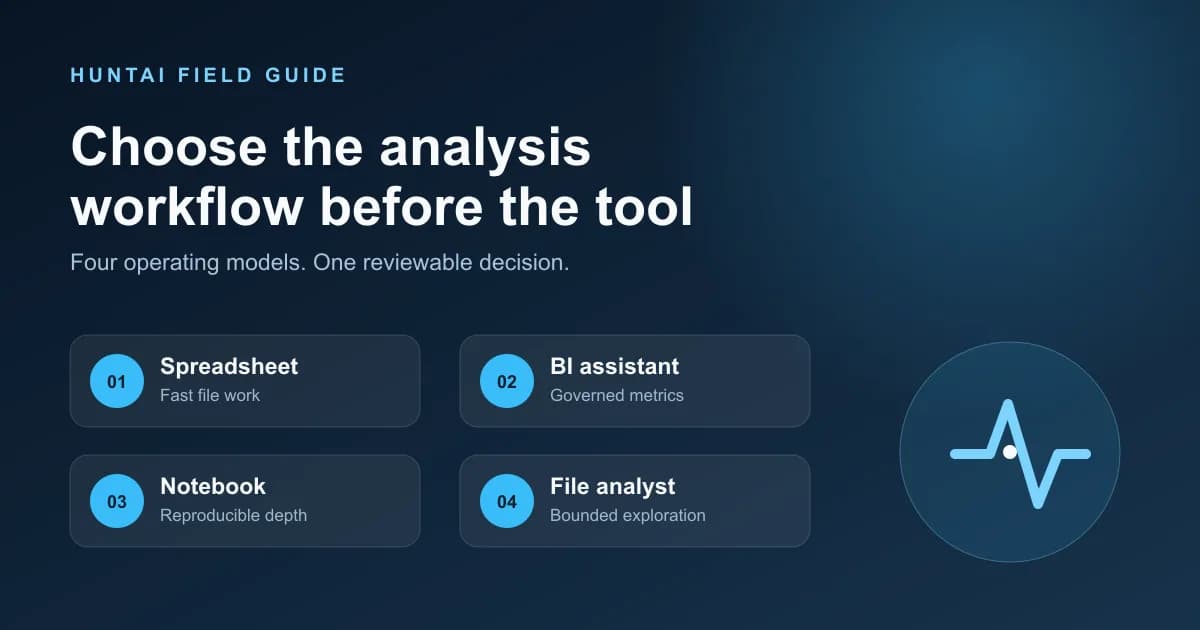
Choose an AI data analysis tool by the evidence you must preserve. Use a spreadsheet copilot for visible file-based work, a BI assistant for governed shared metrics, a notebook copilot for reproducible SQL or Python, and a file-analysis assistant for bounded exploration. Test every candidate on the same dataset, questions, permissions, and review checks.
TL;DR
- Choose the operating model before comparing vendors. A chat box attached to a spreadsheet is not interchangeable with a governed BI layer or a code-producing notebook assistant.
- Match the tool to the evidence you need to preserve: visible workbook logic, governed metrics, executable code, or a reproducible file-analysis session.
- Test candidates on the same dataset and questions. Check row counts, definitions, filters, missing values, calculations, permissions, and whether another person can reproduce the answer.
- Keep human review for financial, legal, clinical, security, personnel, and other high-impact decisions. Fluent explanations are not validation.
Choose the operating model before the vendor
“AI data analysis tool” covers several products with different trust boundaries. One product helps inside a workbook. Another translates questions into queries against a governed business model. A notebook assistant writes or edits SQL and Python. A file-analysis assistant accepts an upload and returns tables, charts, and narrative. A generic ranking hides these differences, so the first decision is where your data, definitions, and review process already live.
Start with the final decision. If one person is cleaning a campaign export, a spreadsheet surface may be enough. If dozens of people need the same definition of active customer or net revenue, use a governed BI workflow. If an analyst must join data, fit a model, or reuse transformations, preserve executable notebook code. If the task is a bounded first pass over a few files, a file assistant can be useful, provided sensitive data is allowed and the output can be checked elsewhere.
Spreadsheet copilot
Best start: A bounded workbook or CSV
Review: Keep formulas, ranges, filters, and inserted outputs visible.
Governed BI assistant
Best start: Shared reports and business metrics
Review: Ground answers in a prepared semantic model and existing permissions.
Notebook copilot
Best start: Reproducible SQL or Python analysis
Review: Review code, environment, execution order, tests, and data lineage.
File-analysis assistant
Best start: Fast exploration of uploaded files
Review: Preserve source files, prompts, generated artifacts, and a path to reproduce the result.
Use a spreadsheet copilot for visible, bounded file work
A spreadsheet copilot fits analysis that already belongs in rows, columns, formulas, pivots, and charts: reconcile a CSV, classify records, explain a variance, draft a formula, or explore a small operational dataset. The benefit is not that spreadsheets become unlimited. It is that the user can inspect the selected range, formula, cell result, filter, and chart in the same artifact the team already shares.
Microsoft documents Python in Excel as Python code entered in workbook cells, calculated in Microsoft Cloud, and returned to the worksheet. It requires internet access and a qualifying subscription; local Python customizations do not automatically carry into that environment. Those details illustrate the questions to ask any spreadsheet product: Where does computation run? Which libraries are available? Can formulas or code be inspected? What happens on unsupported devices? Does the workbook recalculate for the next reviewer?
Avoid this lane when the workbook is acting as an unofficial production database, several teams need governed definitions, the file exceeds practical limits, or a result must be refreshed through a controlled pipeline. AI can make spreadsheet logic faster to create without making hidden cell dependencies easier to govern.
Use a governed BI assistant for shared metrics
A BI assistant belongs where users ask recurring questions about shared business data: revenue by segment, inventory risk, retention by cohort, or performance against an approved target. The assistant should not invent the meaning of revenue from column names. It should inherit a semantic model that defines metrics, joins, permissions, labels, filters, and business terminology.
Microsoft warns that Power BI model owners need to prepare semantic models for AI; without preparation, answers can become generic, inaccurate, or misleading. Its Copilot also has capacity, admin-setting, region, and permission requirements. Google says Looker Conversational Analytics uses LookML as its source of truth, including field definitions, join logic, filtering, aggregation, and access rules. Looker data agents can add golden queries, business glossaries, and default filters. Databricks Genie Spaces follow a related pattern: analysts curate Unity Catalog datasets, sample SQL, business semantics, and instructions, then test and monitor the space.
The buying criterion is therefore not only natural-language fluency. Inspect model readiness, metric ownership, row-level security, query visibility, verified answers, feedback handling, and monitoring. Ask whether the assistant shows the fields and filters it selected. Test ambiguous language such as “new customer” and “top account.” A trustworthy system should map those terms to documented definitions or ask for clarification.
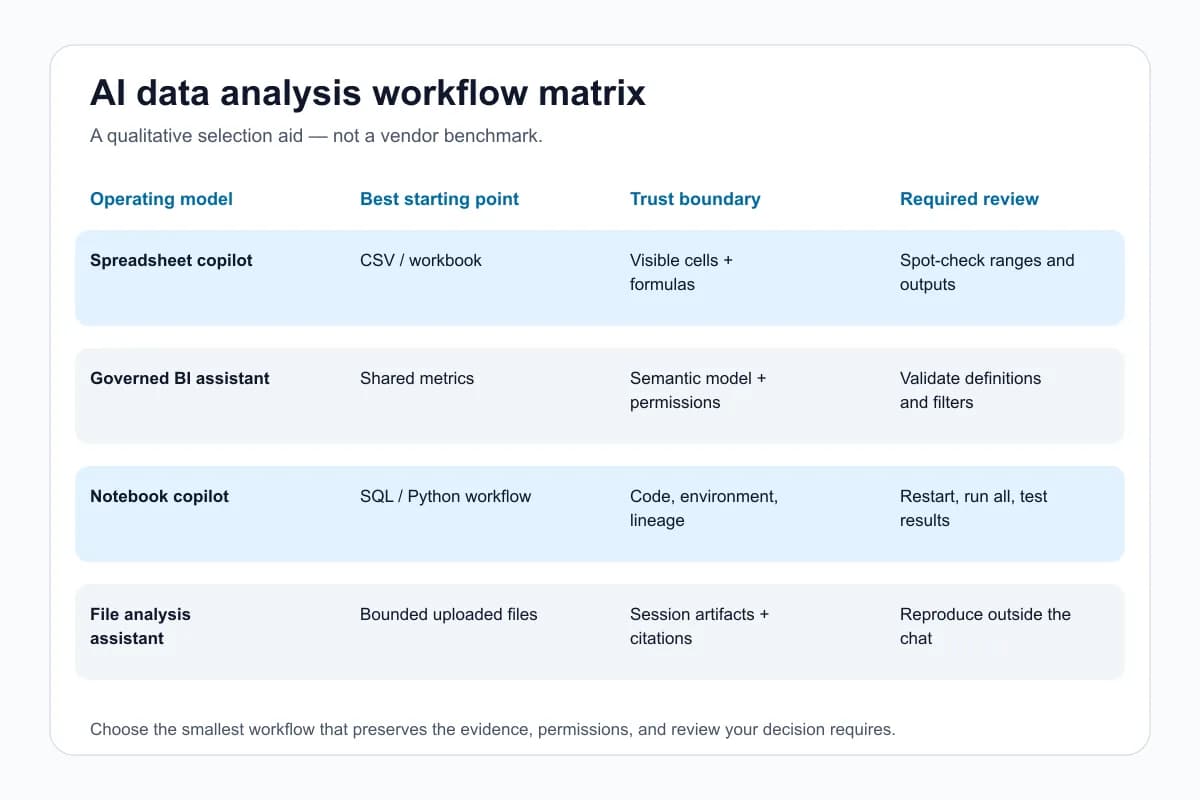
Spreadsheet copilot
Start: A bounded workbook or CSV
Review: Keep formulas, ranges, filters, and inserted outputs visible.
Governed BI assistant
Start: Shared reports and business metrics
Review: Ground answers in a prepared semantic model and existing permissions.
Notebook copilot
Start: Reproducible SQL or Python analysis
Review: Review code, environment, execution order, tests, and data lineage.
File-analysis assistant
Start: Fast exploration of uploaded files
Review: Preserve source files, prompts, generated artifacts, and a path to reproduce the result.
Use a notebook copilot when reproducibility matters
Notebook copilots fit analysts and data scientists who need joins, transformations, statistical checks, custom visualizations, reusable functions, or work that will graduate into a pipeline. The durable artifact is not the assistant's explanation. It is the code, environment, inputs, execution order, outputs, and tests that allow another person to obtain the same result.
Microsoft Fabric's notebook documentation describes an assistant that reads notebook structure, attached lakehouses, tables, files, loaded dataframes, runtime state, and recent execution telemetry. It can generate or refactor code across cells and present changes for approval. The same documentation says to review generated code and validate results because suggestions may be incomplete, inaccurate, or based on outdated library syntax. That limitation applies beyond one vendor.
For evaluation, give each candidate a notebook with a known defect: a many-to-many join that inflates totals, a missing-value rule, an outlier, and a chart with an incorrect denominator. Check whether the assistant notices the problem before producing a confident narrative. Restart the environment, run all cells in order, pin dependencies, compare expected row counts, and add assertions for critical results. A tool that writes code quickly but cannot leave a clean, executable trail creates review debt.
Use a file-analysis assistant for bounded exploration
A file assistant can accelerate the first hour with unfamiliar CSV, XLSX, PDF, or research material. It can profile columns, suggest questions, produce a quick chart, or summarize a collection of documents. This operating model is useful when the goal is exploration rather than a long-lived reporting system.
The boundary is important. Confirm upload limits, retention, model-training policy, regional processing, workspace sharing, source citations, generated code availability, and deletion controls before sending sensitive files. Preserve the original files and a data dictionary. Record the exact question, filters, and exclusions. If the result matters, recreate the calculation in a workbook, BI model, SQL query, or notebook where assumptions are visible.
Eight buying criteria that survive feature churn
- 1. Data boundary. Identify supported sources, file limits, refresh behavior, residency, retention, encryption, private networking, and whether customer data can be used for model improvement.
- 2. Semantic grounding. For shared metrics, require governed definitions, relationships, permissions, business glossaries, verified examples, and a clear owner for changes.
- 3. Inspectability. Prefer visible formulas, selected fields, filters, SQL, Python, citations, or intermediate artifacts over an answer that cannot be traced.
- 4. Reproducibility. Another reviewer should be able to rerun the analysis from the same inputs and obtain explainable results in a clean environment.
- 5. Error behavior. Test missing columns, duplicated rows, ambiguous terms, unsupported requests, stale data, and permission failures. Useful uncertainty is better than fabricated completeness.
- 6. Collaboration. Check version history, comments, approvals, sharing scopes, audit logs, and how an analysis becomes a maintained report or pipeline.
- 7. Operational fit. Include capacity, compute, connector, storage, model, egress, administration, and review time. A low entry price does not imply a low-cost governed rollout.
- 8. Exit path. Export code, queries, workbooks, charts, definitions, and conversation artifacts so the organization is not trapped in an opaque interface.
A reproducible evaluation protocol
Prepare one representative dataset with a data dictionary and a small answer key. Include a duplicated key, null values, an intentionally ambiguous metric, a date boundary, a currency or timezone issue, and a row the evaluator should not be allowed to see. Freeze the source file or warehouse snapshot and give every tool the same business questions.
Ask each candidate to profile the data, calculate two known metrics, explain one anomaly, create one visualization, and answer a follow-up that changes a filter. Record setup time and every clarification. Compare exact values, selected data, transformations, citations, generated code, permission handling, and the time a reviewer needs to trust or reject the result. Do not score visual polish until the numbers are correct.
Then test recovery. Change a column name, remove a source, deny access to one table, or provide conflicting terminology. Observe whether the system asks for help, shows a useful error, silently substitutes another field, or invents an answer. Finally, hand the artifact to a teammate who did not run the test. If they cannot explain and reproduce the result, the workflow is not ready for a consequential decision.
Real products to inspect in HuntAI
HuntAI's AI data analysis catalog is the discovery layer; this article is the decision layer. The catalog confirms that products exist in this category and provides product pages, while official vendor documentation remains the source for current capabilities, requirements, and data handling.
For adjacent discovery, browse the broader data tools topic or compare business intelligence tools. Treat category membership and traffic as discovery signals, not proof that a product fits your governance or analysis workflow.
When an AI analysis tool is the wrong choice
Do not introduce an assistant when the data is prohibited from leaving an approved environment, the metric definitions are disputed, nobody owns source quality, or the team cannot review the generated formulas, queries, or code. Fixing the data contract or semantic model may produce more value than adding a conversational layer.
For a high-impact decision, use AI to propose questions, code, or explanations—not to replace accountable review. Validate calculations against an independent method, document assumptions, preserve the source snapshot, and require subject-matter approval. If the result cannot be reproduced or audited, label it exploratory and keep it out of production decisions.
Conclusion
The best AI data analysis tool is not the one that produces the fastest chart. It is the smallest operating model that preserves the evidence your decision requires. Use spreadsheets for visible bounded work, governed BI for shared metrics, notebooks for reproducible depth, and file assistants for controlled exploration. Run the same evaluation on two candidates and choose the workflow that makes correct results easiest to inspect, reproduce, share, and challenge.